Voila Dashboard
This documentation will elucidate the practical utility of this page and provide a comprehensive breakdown of its various sections. Finally, we will acquaint you with the Tracking Dashboard, elucidating how to effectively enable and harness its tracking capabilities.
Last updated 10 months ago

Voila Shipping Dashboard
Voila Dashboard is a centralised hub for your system's activities. It provides a comprehensive view of the shipment processes, supported by informative charts and graphs that offer a snapshot of your shipment reports.
Accessing the dashboard is straightforward; it serves as the homepage upon logging into your platform. If you navigate to other pages and wish to return to the dashboard, click on the "Dashboard" button on the left-hand side. By default, the "Voila Dashboard" will be visible upon entering this page.
At the top of the page, you'll find a set of filters, a potent tool for refining your shipment search. Here's a comprehensive breakdown of these filter parameters:
Couriers: This option allows you to choose courier services for your review specifically.
Friendly Service Name: Use this filter to search for shipments linked to a particular courier preset. You can input either the Service ID or the preset name. For example, you can enter "IPX-DPDND" as the Service ID or "DPD Parcel Next Day" as the name. For a more in-depth understanding of courier services and presets, refer to the "How to Add a Courier Service" document.
API Account: This filter is relevant for retailers or individual API users with a single API Account. However, resellers or agencies managing Voila for multiple customers may have various API user accounts (configurable on the "API Accounts" page). Use this filter to select the API account(s) you wish to examine.
To Country: Choose the desired country or countries to focus on shipments destined for a specific location.
You’ll find the date picker on the right side of the filters. This feature empowers you to specify the date range for your search. To adjust the date range, click on the calendar icon. You have two options:
Manual Date Range: Select a date range from the calendar.
Fast Date Picker: This convenient feature provides preset date range options commonly used, such as "This Week," "Last Week," "Month," and more.
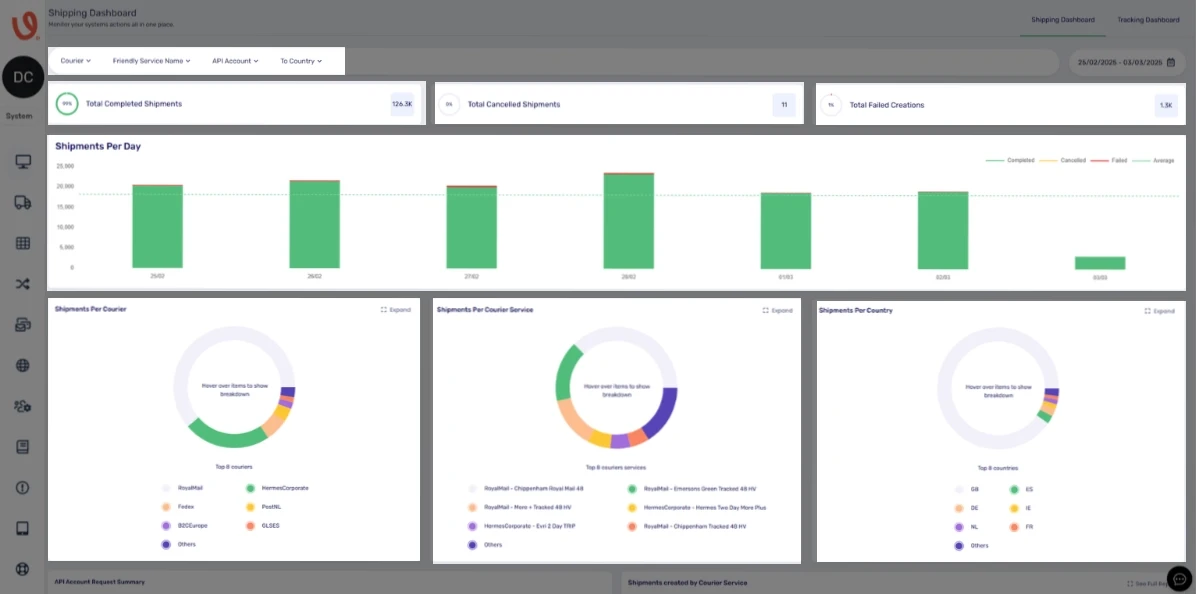
Directly below the filters, you'll encounter the general statistics section. Here, you can view the percentage and number of shipments based on your chosen date and filters. This section offers insights into total completed, cancelled, and failed creations.
Beneath the general statistics section, you'll find the "Shipments Per Day" chart. This chart provides a comprehensive breakdown of the selected dates, categorising them by day. It includes completed, cancelled, failed, and average shipment stats.
Further below, you'll encounter pie charts representing shipments per courier, per courier service, and country. Hovering over these pies reveals a detailed breakdown of the entries. Clicking the "Expand" button for any charts opens a window displaying comprehensive information about the respective pie charts.
You'll find the "API Account Request Summary" section on the bottom left of the screen. This table presents an overview of all the API accounts you've selected via the filter and their general statistics for the chosen dates. It includes the number of completed, cancelled and failed shipments. Clicking the "View" button for any entry here takes you to the "Shipments" page, displaying only the selected API account for the chosen dates. For further details about the "Shipments" page, refer to our documentation.
Finally, on the bottom right side of the screen, you'll encounter the "Shipments Created by Courier Service" section. It provides a comprehensive breakdown of the selected couriers and services, including their percentages, indicating how many shipments were created using each courier.
Click to Maximise the Image.

Voila Tracking Dashboard
For comprehensive guidance, kindly consult our "Tracking Dashboard on Voila" documentation page.
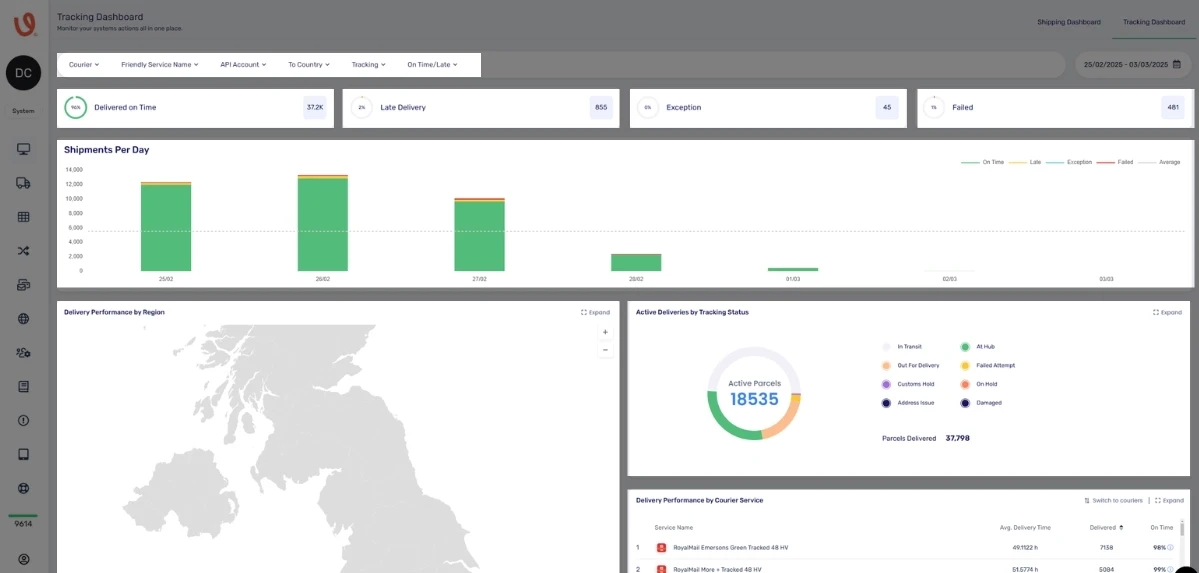
The Tracking Dashboard can concentrate on efficiently monitoring shipments within the system. The visual representation below furnishes an informative display of shipment details, primarily focusing on today's shipments by default.
Similar to the Voila Dashboard, the Tracking Dashboard also incorporates filters, as discussed in the preceding section. In addition to those, there are two additional fields, elaborated upon below:
Tracking: This field allows you to track shipments with specific statuses, including "Booked," "Collected," and "Delivered."
On-Time/Late: This field facilitates tracking shipments with defined time-based statuses such as "Expected Late," "Expected On Time," "Delivered Late," or "Delivered On Time."
Beneath the Tracking Dashboard, you'll find the "Shipments Per Day" or "Per Hour" chart, depending on the date range you've selected. It illustrates the distribution of shipments across the chosen time interval, with each shipment status clearly distinguished by colour coding for ease of interpretation.
Furthermore, the dashboard features two supplementary charts: "Delivery Performance by Region", "Active Deliveries by Tracking Status", and "Delivery Performance by Courier Service." By clicking the "Expand" button in the top right corner of these fields, you can view them in full-screen mode, making it effortless to examine the details by hovering over the sections.
Click to Maximise the Image.

Next Steps & Support
📚 Need help? Explore more of our documentation, video walkthroughs or contact support.
With Voila, you will be set up for seamless, efficient shipping.
